
Table of Contents
Understanding Stock Charts:
The Foundation of Technical Analysis
Before diving into the world of trading strategy, it’s essential to grasp the basics of stock charts. In the stock market, a chart is a graphical representation of a stock’s historical price movements. These charts serve as valuable tools for technical analysis, aiding investors in making informed decisions.
Unveiling Candlestick Charts:
Visualizing Market Trends
One of the most popular types of stock charts is the candlestick chart. Picture it as the storyteller of stock prices, where each candlestick provides information about the opening, closing, high, and low prices for a specific time period. Understanding candlestick patterns empowers traders to identify trends and potential reversal points in the market.
Navigating Support and Resistance:
Pillars of Price Analysis
In the dynamic world of stocks, recognizing support and resistance levels is paramount. Support represents a price level where a stock tends to stop falling, while resistance is a level where it often tops out. Learning to identify these key levels on a chart equips traders with valuable insights into potential entry and exit points.
Rethinking RSI:
A Unique Approach to Technical Indicators
Enter the Relative Strength Index (RSI), a widely used technical indicator. While many see RSI as an overbought or oversold signal with traditional thresholds at 70 and 30, we’re taking a different approach.
The Unconventional Use of RSI for Trading Strategy
Rather than viewing RSI in binary terms, we’ll explore a nuanced strategy. Instead of considering 70 as a strict overbought signal and 30 as oversold, we’ll delve into a more dynamic approach.
Guiding Both Novice and Experienced Traders
Whether you’re a seasoned trader or just stepping into the world of markets, this article is tailored for those seeking a foundational understanding of a reliable trading strategy. It’s important to note that while experienced traders might have their perspectives, the beauty of this strategy lies in its simplicity and adaptability for traders at any level.
Embrace Diversity in Trading Strategies
In the diverse realm of trading, there isn’t a one-size-fits-all strategy. Every method has its strengths and weaknesses. The key is to find a strategy that resonates with you and aligns with your risk tolerance and financial goals. Remember, the success of a strategy often hinges on your belief in its efficacy.
The Fundamental Pillars of a Robust Strategy
A well-defined trading strategy comprises two crucial elements: an entry plan and an exit plan. Back testing, a process of assessing a strategy’s performance against historical data, serves as the litmus test for its effectiveness. Once a strategy proves its worth through back testing, the golden rule is to stick to it. Avoid the temptation to constantly seek new mentors or strategies; instead, trust and follow the plan you’ve meticulously crafted.
Unveiling the RSI 60-40 Strategy
At the heart of our approach is the Relative Strength Index (RSI), a versatile technical indicator. Instead of rigidly adhering to conventional overbought (above 70) and oversold (below 30) levels, we take a dynamic stance.
- Bullish Territory (RSI > 60): A signal that the market is in an upward trend, suggesting potential buying opportunities.
- Bearish Territory (RSI < 40): Indicates a downward trend, signaling potential selling opportunities.
- Side ways market (40<RSI<60): Indicates a sideays market, signaling wait for a fresh break out for entries.
The Gray Area:
RSI Between 60 and 40
In the dynamic landscape of the stock market, an RSI value between 60 and 40 introduces a nuanced perspective. This zone suggests a market in transition, where neither the bulls nor the bears have a firm grip. Understanding the implications of this gray area is crucial for traders looking to navigate choppy waters effectively.
Applicability Across Markets
One of the strengths of this strategy is its universal applicability. Whether you’re involved in stock analysis, swing trading, intraday trading, options trading, or even venturing into the realm of cryptocurrencies, this strategy can be a valuable tool in your arsenal.

Above is how we setup RSI Indicator in Trading View.
Mastering Swing Trading: Selecting Winning Stocks
Top-Down Approach: A Blueprint for Success
The art of swing trading involves a meticulous selection process that starts with a top-down approach, analyzing broader market trends before narrowing down to specific sectors and stocks.
Market Overview:
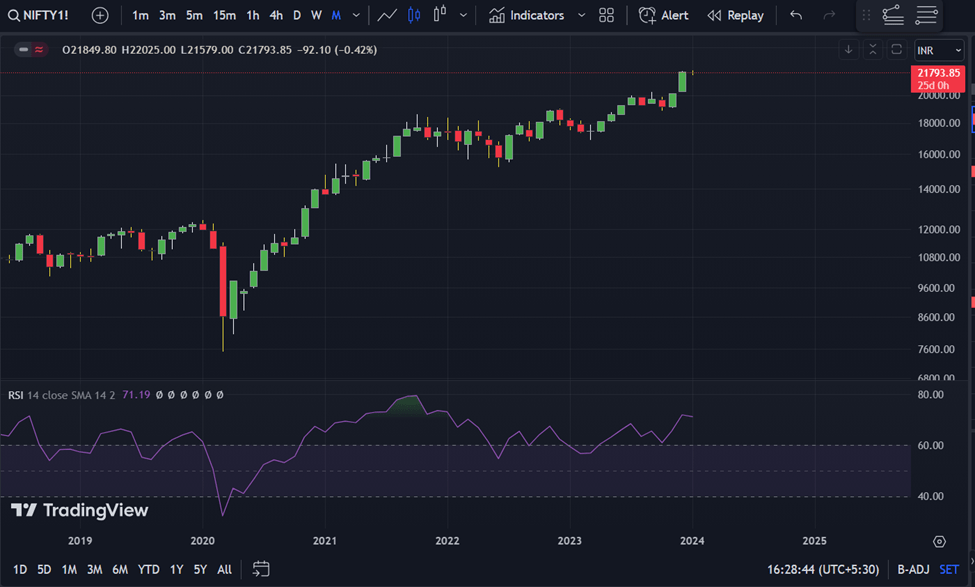
NIFTY Monthly Chart
Begin with an overview of the market using the NIFTY monthly chart. From the start of 2023, the RSI consistently hovers above 60, signaling sustained momentum. The strong rally since November 2020 is noteworthy, although retracements remind us of the market’s dynamic nature.
Confirmation Across Timeframes:
Monthly, Weekly, Daily
Monthly Chart: RSI maintains strength above 60, indicating a robust long-term trend.
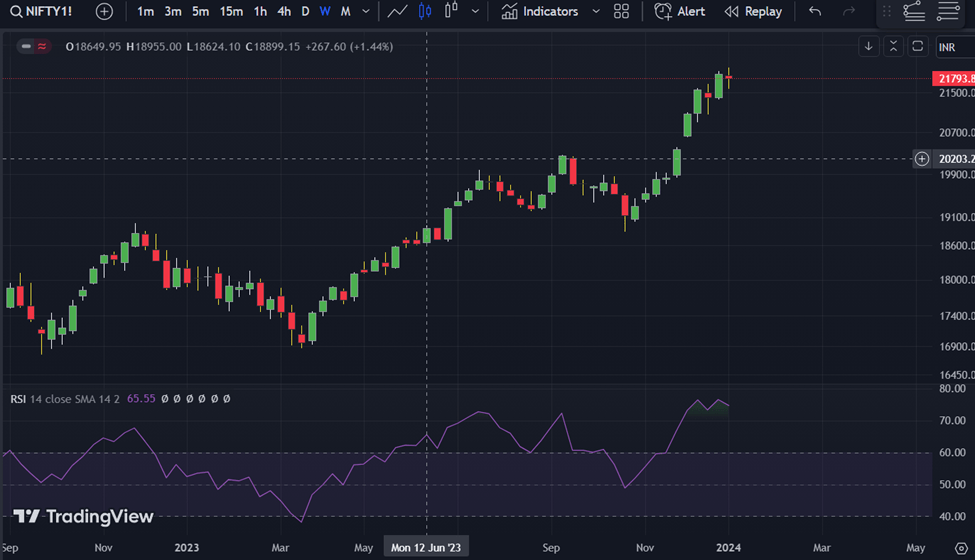
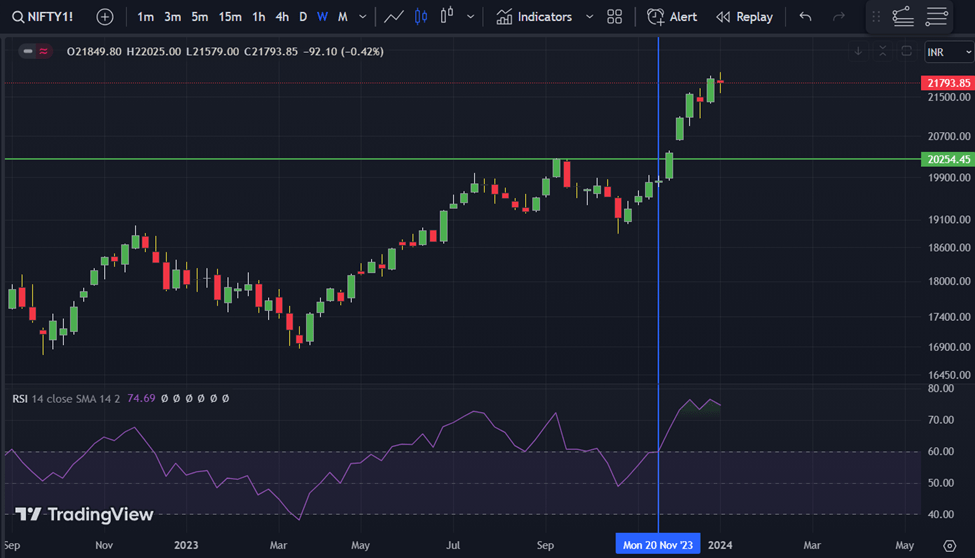
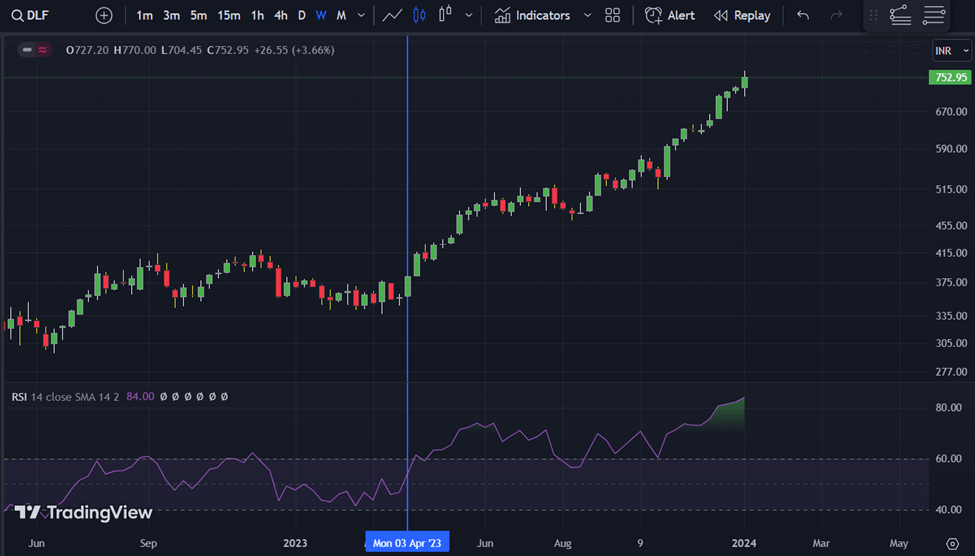
Weekly Chart: Since November 2023, the RSI crosses above 60, affirming the momentum.
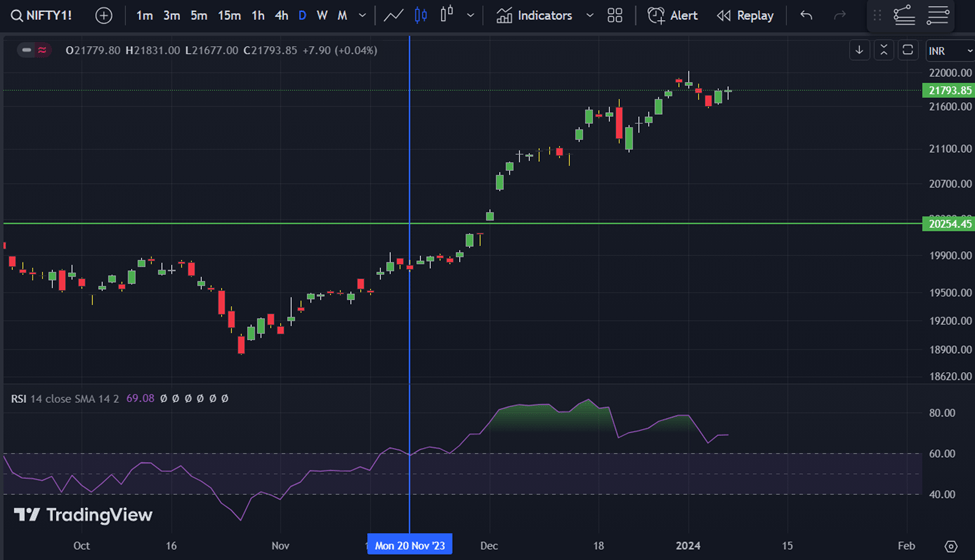
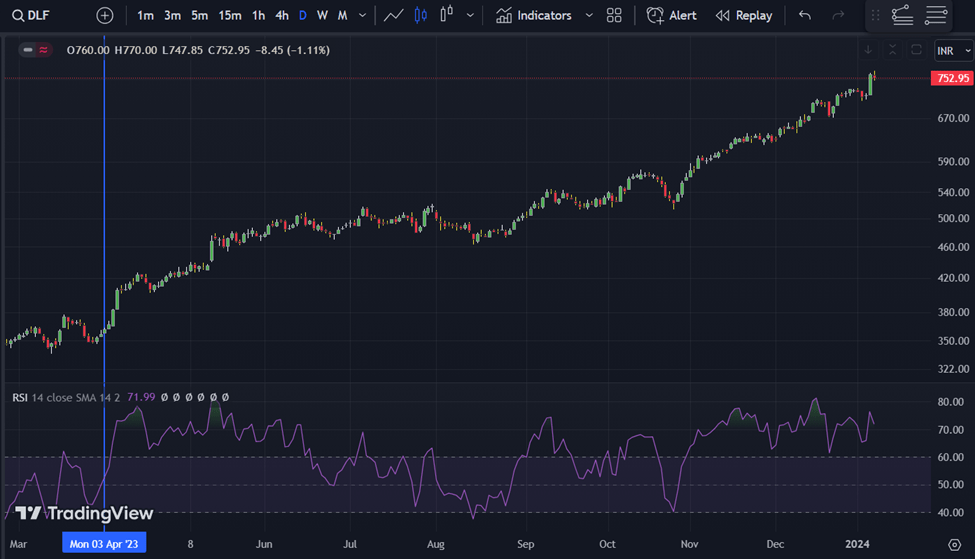
Daily Chart: The daily RSI remains strong, further supporting the overall bullish sentiment.
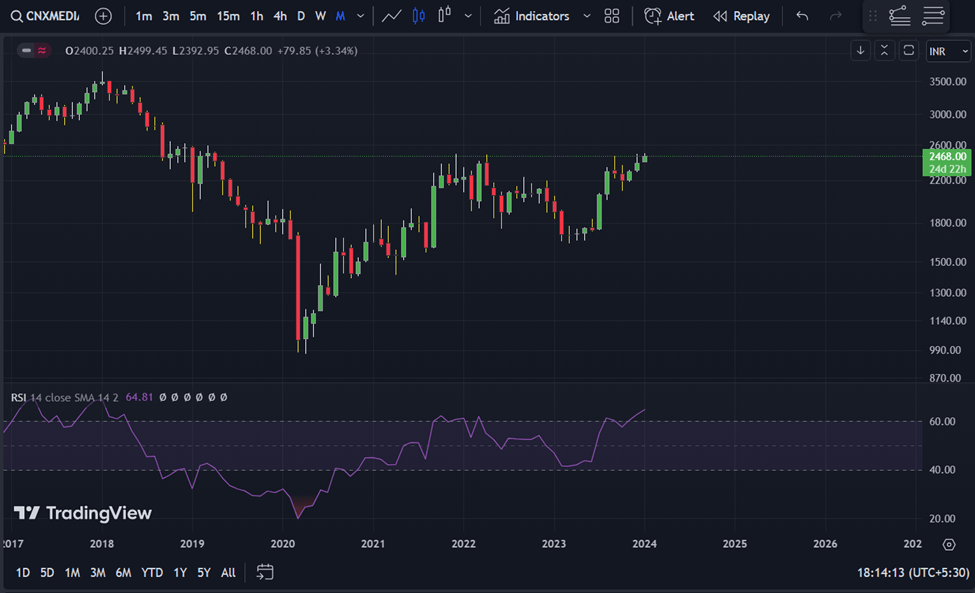
Sector Analysis: Media vs. Realty
Media Sector:
Sideways market indicated by RSI between 60 and 40. Caution is advised, especially with the RSI approaching resistance at 2500. A breakout may signal a potential trend, but until then, it remains in a sideways phase.
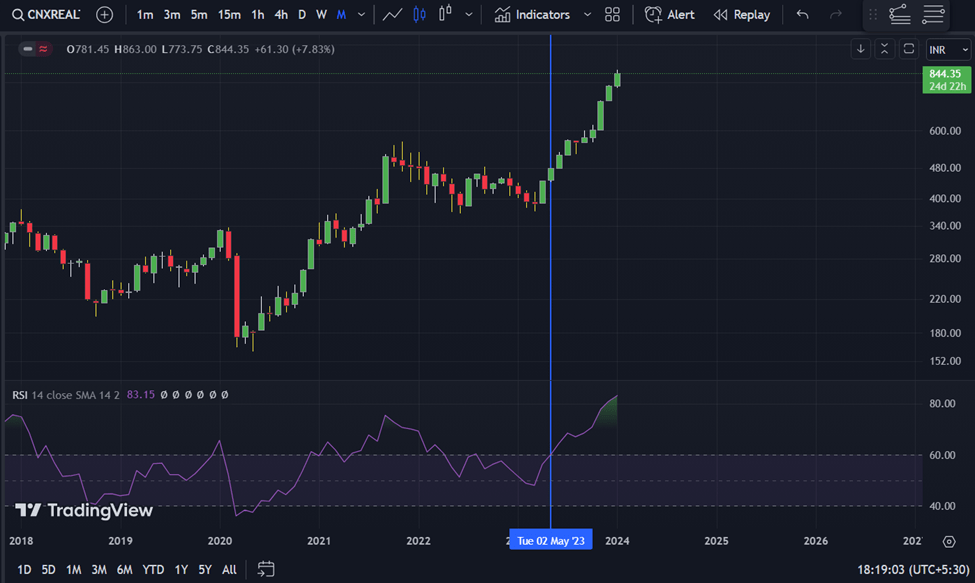
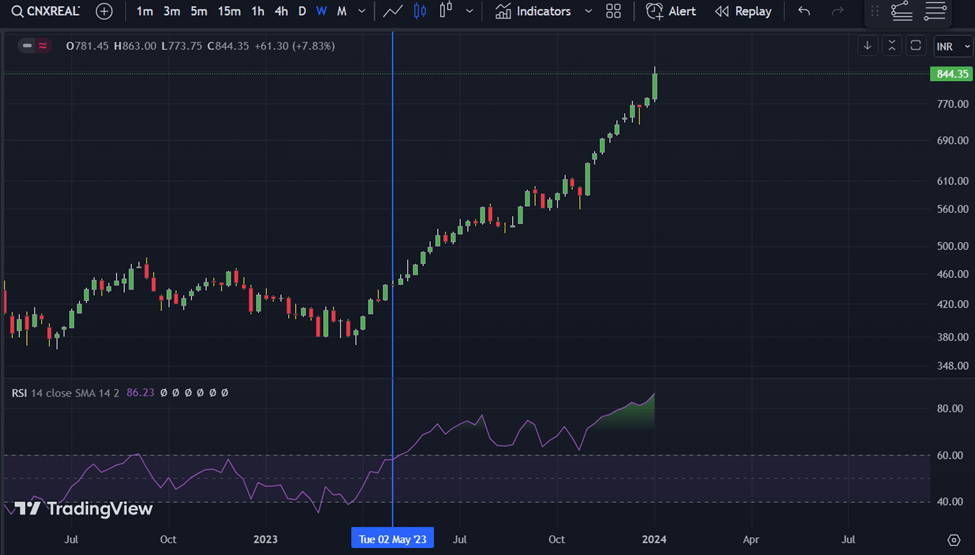
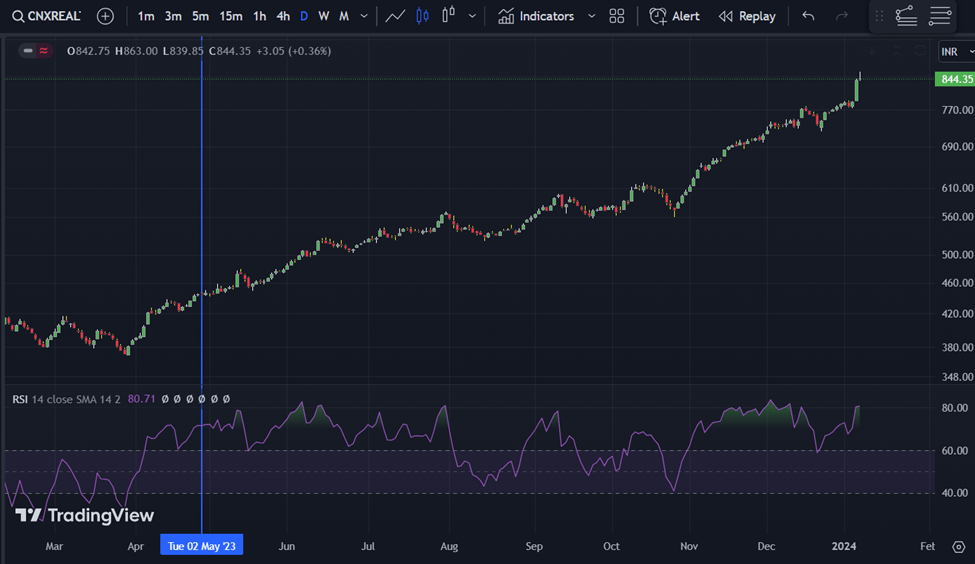
Realty Sector:
Clear upward momentum with RSI consistently above 60 since May 2023 across all timeframes.
Stock Selection: DLF in Focus
DLF Stock Analysis:
Monthly RSI: Crossed above 60 in April-May 2023, indicating a strong uptrend.
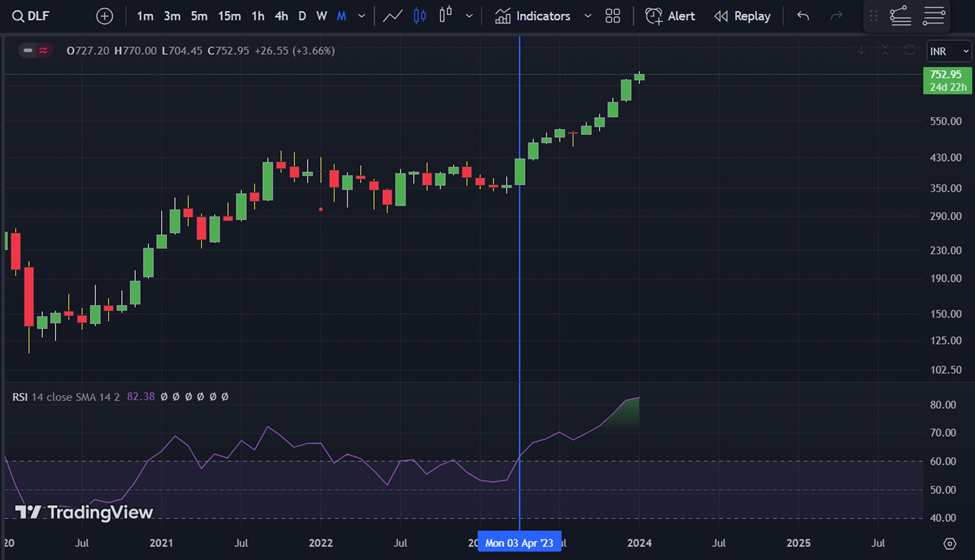
Weekly RSI: Maintains strength above 60, confirming the bullish momentum.
Daily RSI: Exhibits robust momentum, with key support observed around RSI 40.
Swing Trade Setup: Key Criteria
Monthly RSI Above 60: Ensures a strong long-term trend.
Weekly RSI Above 60: Affirms the sustained momentum.
Daily RSI Support at 40: Provides potential entry points during retracements.
Optimal Entry Points:
Breakout Scenario: Consider entering when the stock breaks crucial resistance.
RSI Crosses Above 60 (Daily): Signals a potential uptrend continuation.
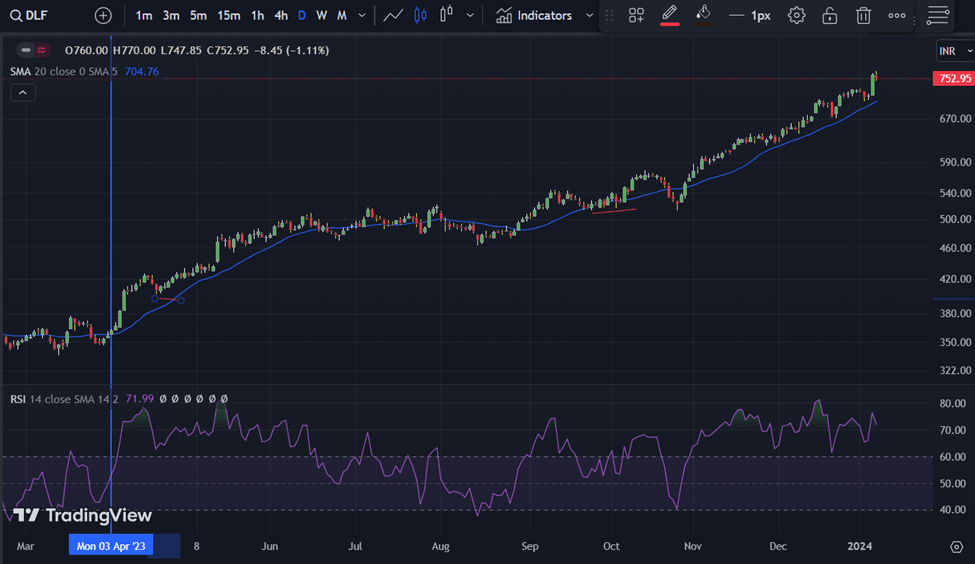
Retracement to Moving Averages: Opportune moments to enter during a pullback.
Timing Matters: Managing Risk
Buy at RSI 40 Support: Consider entering around 485 during RSI 40 support, aligning with the uptrend.
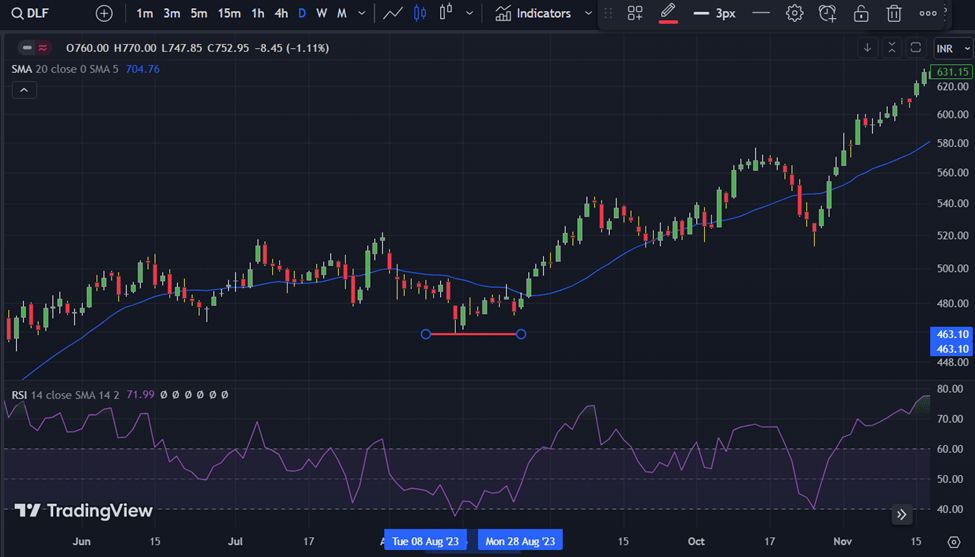
RSI Below 40 (Daily): A breakdown below RSI 40 may indicate the start of a new downtrend, prompting caution.
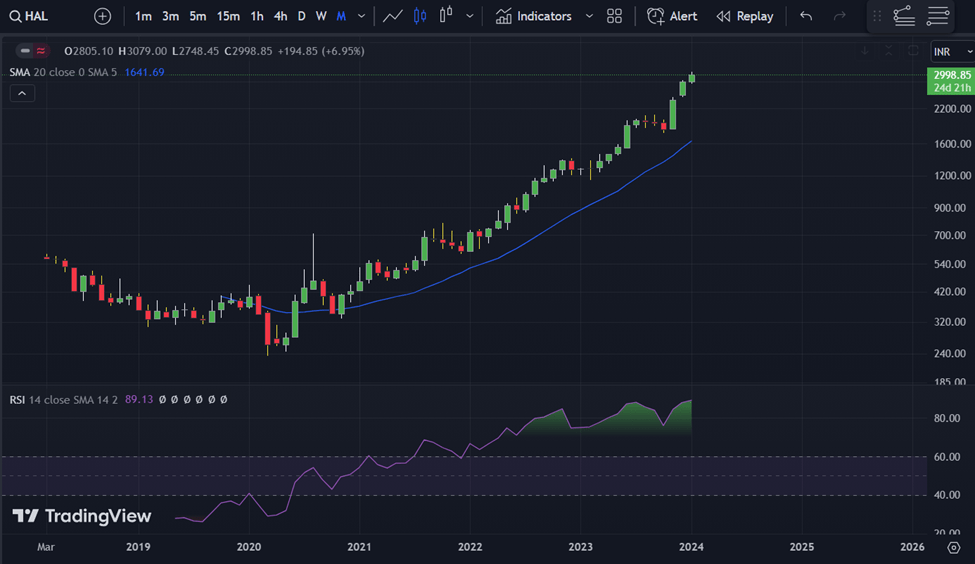
Case Study on HAL
Analyzing HAL’s Momentum: A Multi-Timeframe Approach
Hindustan Aeronautics Limited (HAL) is in your portfolio, and it’s essential to evaluate its momentum across multiple timeframes for effective decision-making.
Monthly Chart Analysis: A Strong Uptrend
Monthly RSI: HAL showcases robust momentum with the RSI consistently above 60. This indicates a strong long-term uptrend, providing confidence in the stock’s overall direction.
Weekly Chart Examination: Sustained Momentum
Weekly RSI: HAL maintains its strength on the weekly chart, affirming the sustained momentum observed on the monthly timeframe. This consistency is crucial for confirming the health of the prevailing trend.
Daily Chart Breakout: A Positive Signal
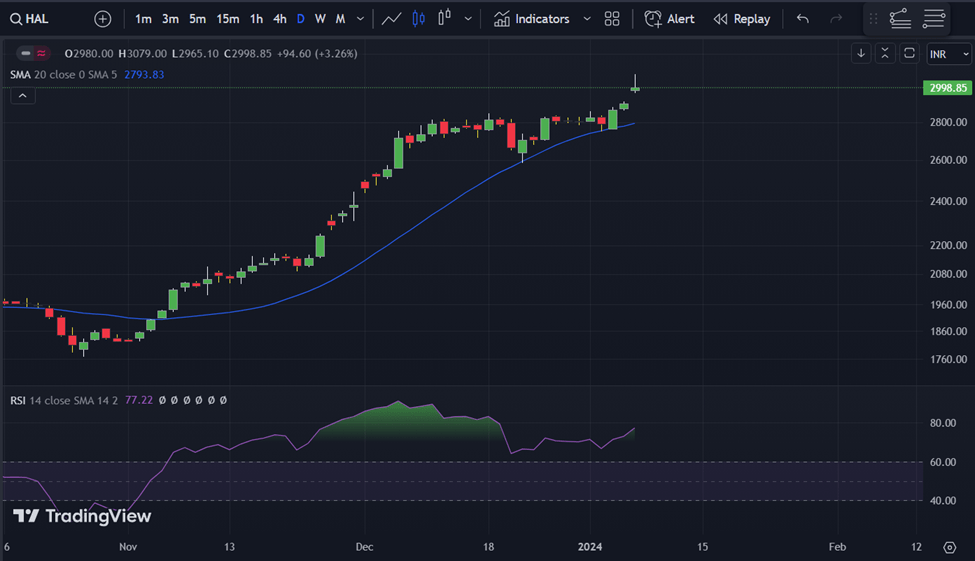
Daily RSI: HAL exhibits strong momentum on the daily chart, marked by a breakout. This signals short to intermediate-term strength, providing additional confirmation of the stock’s positive trajectory.
Decision Time: Hold or Adjust?
Given HAL’s impressive performance across monthly, weekly, and daily timeframes, holding the stock seems reasonable. However, it’s crucial to anticipate potential retracements.
Exit Strategies: Plan for the Future
Retracement Consideration: Acknowledge that HAL’s price movement may have completed a cycle, and retracements are possible.
20-Day Moving Average: Keep an eye on the 20-day moving average. A retracement to this level could provide a buying opportunity, especially if the overall trend remains intact.
Risk Management: Protecting Your Investment
Exit Below Recent Low: Consider setting an exit point below the recent low. This can help protect profits and prevent potential losses if the stock experiences a significant downturn.
Exit Below 20-Day Moving Average: Another exit strategy is to consider selling if the stock falls below the 20-day moving average. This can act as a dynamic support level.
Applicability Across Markets: Beyond Stocks
The principles discussed for HAL’s analysis are not limited to stocks alone. This multi-timeframe approach, considering monthly, weekly, and daily charts, is applicable across various markets, including cryptocurrencies. The key is adapting the strategy to the specific characteristics of each market.
Conclusion: Mastering Multi-Timeframe Analysis
Mastering the art of managing a portfolio involves a nuanced understanding of a stock’s momentum and potential retracement points. By employing a multi-timeframe analysis approach, traders can make informed decisions that align with the prevailing market trends.
Stay tuned for more insights and real-world examples as we delve deeper into mastering portfolio management and trading strategies.
The Market Info
3 thoughts on “A Beginner’s Guide to Trading: Strategy 2024”