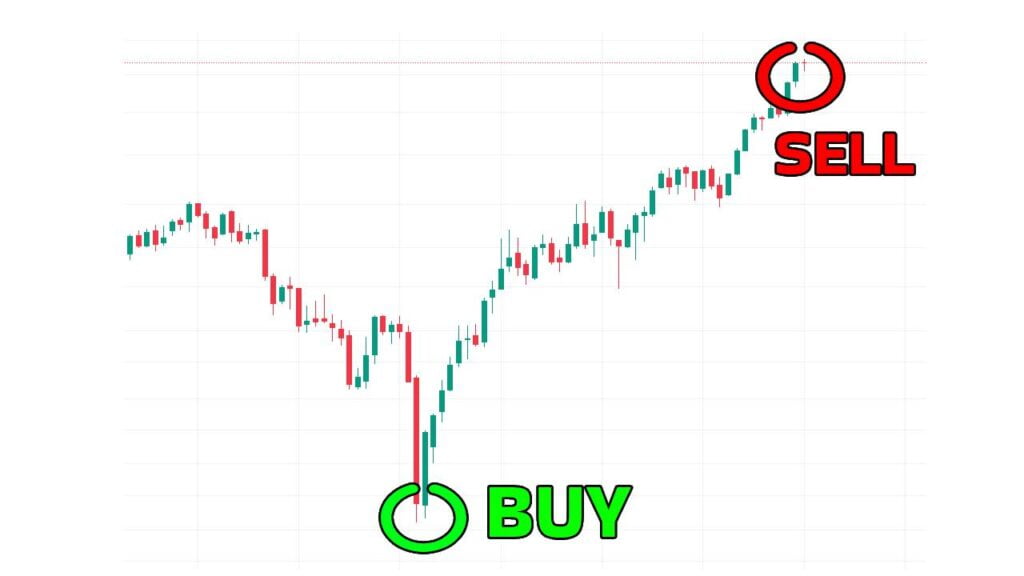
A Step-by-Step Guide to Buying Breakout Stocks
In the dynamic world of trading or investing, identifying breakout stocks before they make a significant move is a skill that sets successful traders or investors apart.
The allure of substantial gains often accompanies these market movers, making them a focal point for traders seeking to optimize their portfolios. In this comprehensive guide, we will delve into a step-by-step strategy designed to help you identify stocks.
From understanding support and resistance levels to analyzing market trends and leveraging key indicators, we’ll explore actionable steps that empower investors to make informed decisions. Join us as we decode the secrets behind buying stocks strategically, with a keen focus on competitive advantage, chart patterns, and fundamental analysis.
STEP 1: Use RSI Indicator 60 – 40
As discussed in A Beginner’s Guide to Trading: Strategy 2024 we can use RSI as momentum indicator other than some Over Sold or Over Bought indicator.
Relative Strength Indicator – RSI in setting use 60 – 40 levels.
- Bullish Territory (RSI > 60): A signal that the market is in an upward trend, suggesting potential buying opportunities.
- Bearish Territory (RSI < 40): Indicates a downward trend, signaling potential selling opportunities.
- Side ways market (40<RSI<60): Indicates a sideays market, signaling wait for a fresh break out for entries.
Step 2: Choose Time Frame
Daily Time Frame – Short Term Trades (2-3 weeks)
Weekly Time Frame – Medium Term (1-2 months)
Monthly Time Frame – Long Term (1-2 years)
Time frames depend on multiple factors, including current market trends and sector performances. If these indicators aren’t favorable, we might have to avoid prolonged holdings. As traders, it’s crucial to enter the market during trending conditions. Utilizing tools like RSI can assist in identifying the stock’s trend or momentum, aiding in making informed decisions.
Step 3: How to Identify Momentum and Buy
As mentioned earlier, an RSI value above 60 indicates momentum; however, for an optimal entry point, we prefer waiting for the RSI to find support around the 60 level. This signifies a robust bullish sentiment in the underlying stock, enhancing the prospects for a more favorable entry.
Let’s see an example:
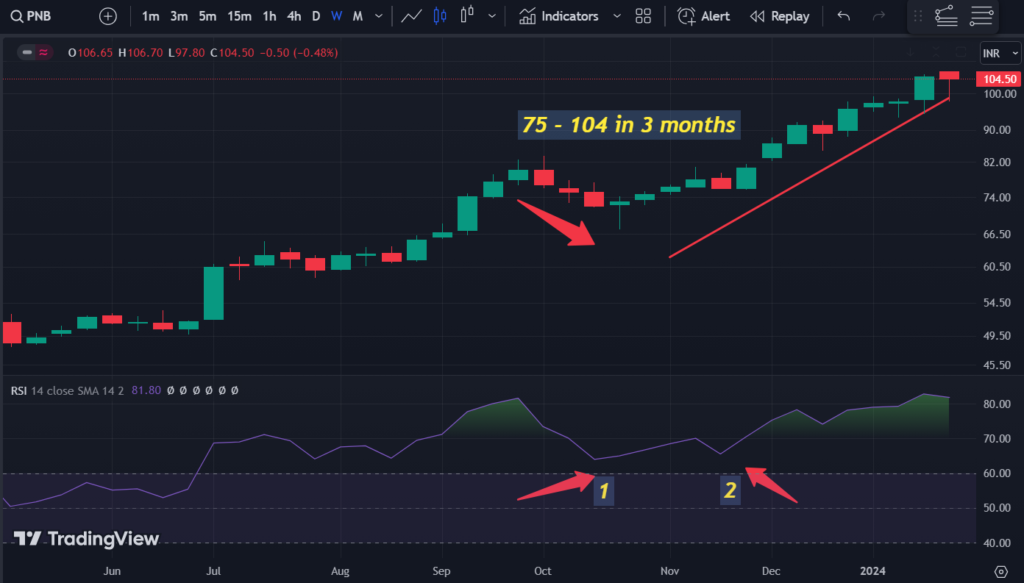
Here 1 and 2 indicates when RSI took support at 60 levels, and it moved from 75 to 104 in 3 months.
Stock Name: PNB, Punjab National Bank
This strategy works in every market and Crypto too.
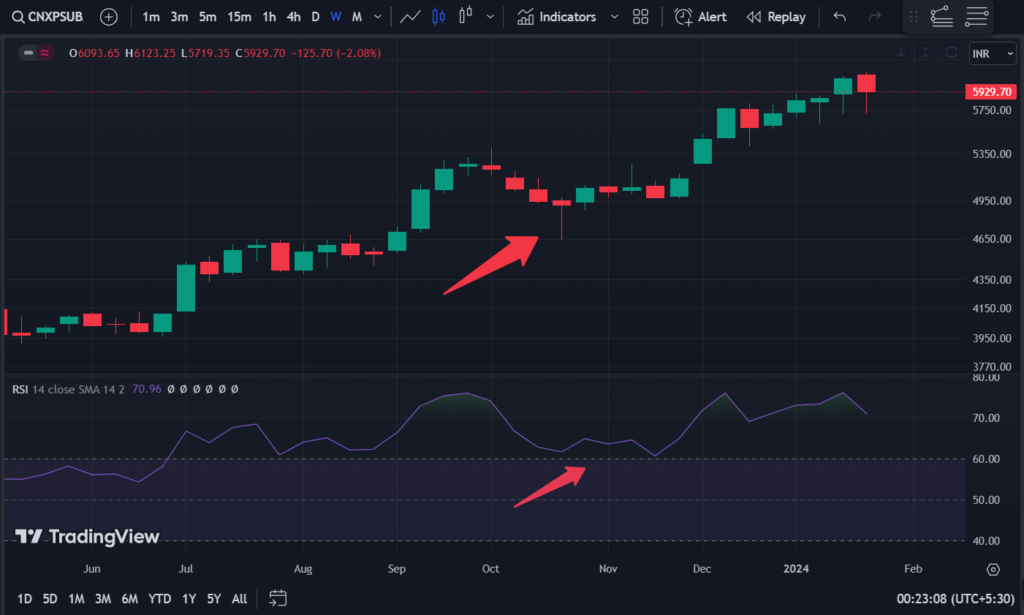
PNB bank is from the NIFTY PSU Sector during the same time when PNB made the move the PSU bank sector also was showing the similar momentum which supported the move in PNB.
If the sector is in momentum the underlying Stock also could show similar momentum.
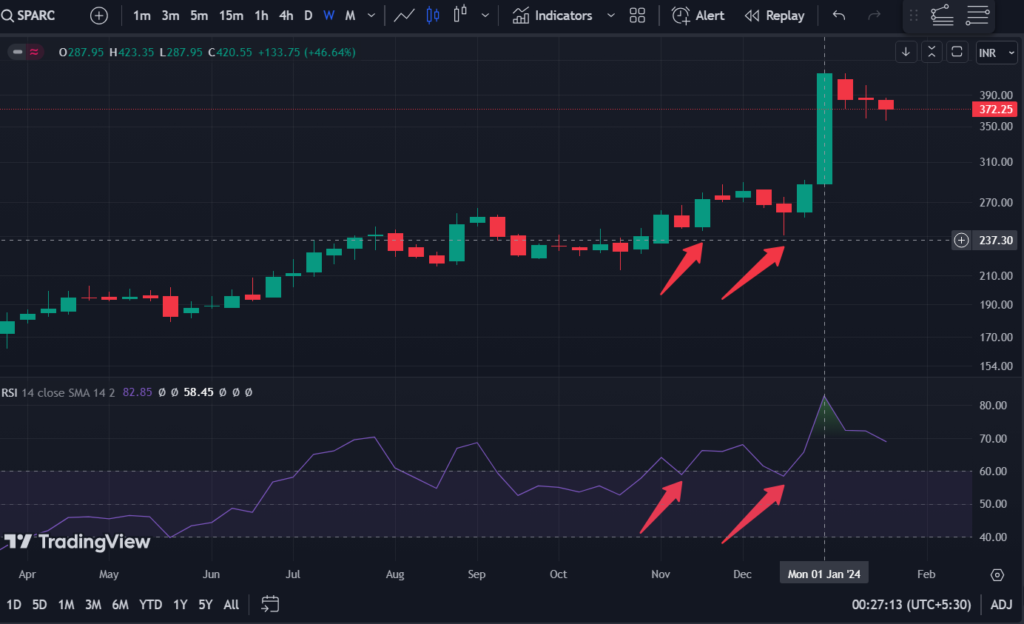
You can see in 1 week after RSI taking support at 60 level the Stock moved 46% up, so we could get such big moves using this Strategy.
Step 4: Entry and Exit or Stoploss
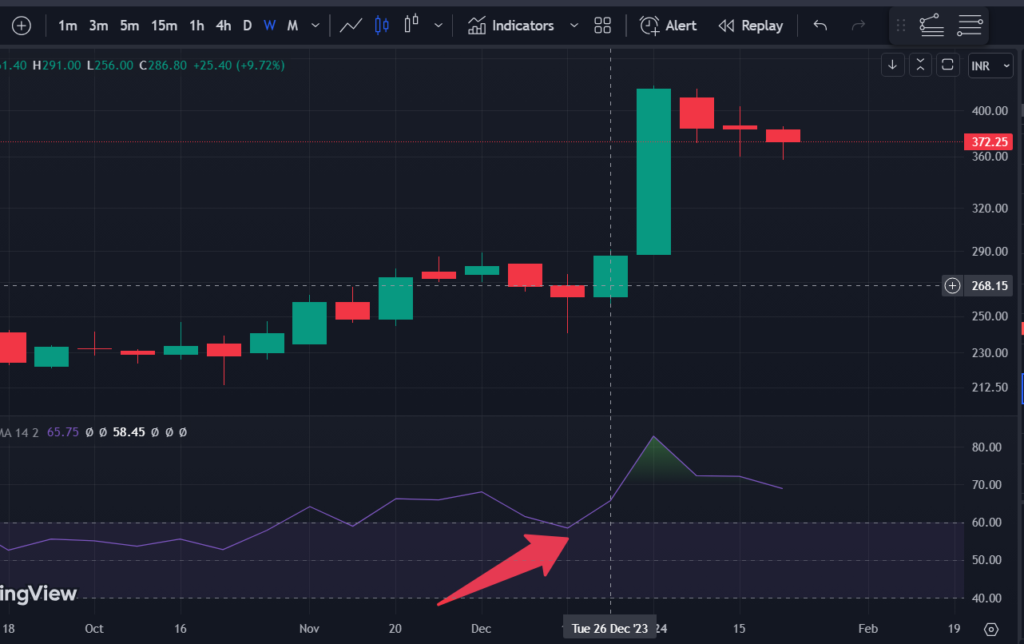
In the above example Entry could be made in the small green candle after RSI 60 support, this green candle confirms the Support area.
We don’t keep a target to reach to exit because target is infinity as long as the trend continues.
However, there should always be an Exit plan, such as if the price crosses below the 20-day moving average or the low of the previous two candles. These considerations are crucial in managing trades effectively.
Stoploss should be previous swing low or entry candles low depending on your risk tolerance.
So, you can start by:
Identifying the sector in momentum using RSI as suggested in the guide.
Identify a stock from that sector with good momentum using RSI.
Identify Entry when RSI takes support at 60 levels indicating really bullish momentum and have an exit or stoploss plans in place.