Table of Contents
Fundamental Analysis of HDFC Bank: Decoding Financial Strength
Understanding the Bedrock: Shareholder’s Funds
- Equity Share Capital (MAR 23): Rs. 557.97 Cr
- Analysis: A consistent increase signals growing investor confidence and potential for expansion. The bank’s reliance on equity financing ensures a stable capital base.
- Reserves and Surplus (MAR 23): Rs. 2,79,641.03 Cr
- Analysis: The substantial reserves showcase robust financial health, providing a safety net for the bank during economic uncertainties. Retained earnings and accumulated profits contribute to the bank’s overall strength.
- Total Shareholders Funds (MAR 23): Rs. 2,80,199.01 Cr
- Analysis: The sum of equity share capital and reserves indicates a formidable financial foundation, crucial for sustaining the bank’s operations and facilitating future growth.
Examining the Financial Structure: Capital and Liabilities
- Deposits (MAR 23): Rs. 18,83,394.65 Cr
- Analysis: Higher deposits signify a strong customer base, reflecting trust and loyalty. A sizable deposit base provides the necessary funds for lending and other banking activities.
- Borrowings (MAR 23): Rs. 2,06,765.57 Cr
- Analysis: While essential for expansion, monitoring borrowings is crucial. Responsible debt management ensures the bank maintains a healthy financial structure and meets its financial obligations.
- Other Liabilities (MAR 23): Rs. 95,722.25 Cr
- Analysis: Miscellaneous liabilities require scrutiny for potential impact on the bank’s financial position. Managing and understanding these liabilities is crucial for overall financial health.
Unveiling the Pillars: Assets
- Cash and Balances with RBI (MAR 23): Rs. 1,17,160.77 Cr
- Analysis: Adequate cash reserves ensure liquidity for day-to-day operations, offering resilience against unforeseen challenges. This liquidity is vital for maintaining the bank’s stability.
- Advances (MAR 23): Rs. 16,00,585.90 Cr
- Analysis: Increasing advances indicate the bank’s active role in supporting economic growth. However, prudent risk management is essential to maintain a healthy loan portfolio.
- Investments (MAR 23): Rs. 5,17,001.43 Cr
- Analysis: A diversified investment portfolio reflects a balanced approach for income generation and risk management, showcasing the bank’s financial acumen.
Key Performance Indicators: Assessing Financial Health
- Capital Adequacy Ratio (MAR 23): 19.26%
- Analysis: A high ratio indicates the bank’s ability to cover risks, showcasing a robust capital position. This ensures the bank is well-prepared to handle unexpected losses.
- Tier 1 Capital (MAR 23): 17.13%
- Analysis: The high Tier 1 capital percentage signifies a strong financial structure, providing a buffer against financial stress and supporting the bank’s long-term stability.
Quality Check: Asset Quality
- Gross NPA Percentage (MAR 23): 1.12%
- Analysis: The low percentage of non-performing assets reflects healthy asset quality and effective risk management practices.
- Net NPA Percentage (MAR 23): 0.27%
- Analysis: Efficient recovery of bad loans is indicated by the low net NPA percentage, showcasing the bank’s commitment to maintaining a sound loan portfolio.
Future Preparedness: Contingent Liabilities and Commitments
- Contingent Liabilities (MAR 23): Rs. 1,748,130.32 Cr
- Analysis: Monitoring these potential future obligations is essential for assessing the bank’s exposure to unforeseen risks and understanding its capacity to fulfill commitments.
Conclusion: HDFC Bank’s fundamental analysis reveals a company with a robust financial foundation, prudent management, and a strategic approach to growth. Investors can find confidence in the bank’s strength, stability, and efficient risk management practices, positioning HDFC Bank as a reliable player in the financial landscape. Mastering the Art of Fundamental and Technical Analysis for Explosive Insights into HDFC Bank’s Financial.
Technical Analysis of HDFC Bank as of January 2024
As of January 2024, HDFC Bank’s current share price stands at 1672. Our technical analysis employs a top-to-bottom approach, utilizing multiple time frames to provide a comprehensive perspective.
Long-Term Monthly Chart: A History of Stellar Performance
Upon examining the long-term monthly chart, it’s evident that HDFC Bank has consistently delivered stellar performances, showcasing sustained growth over the years.
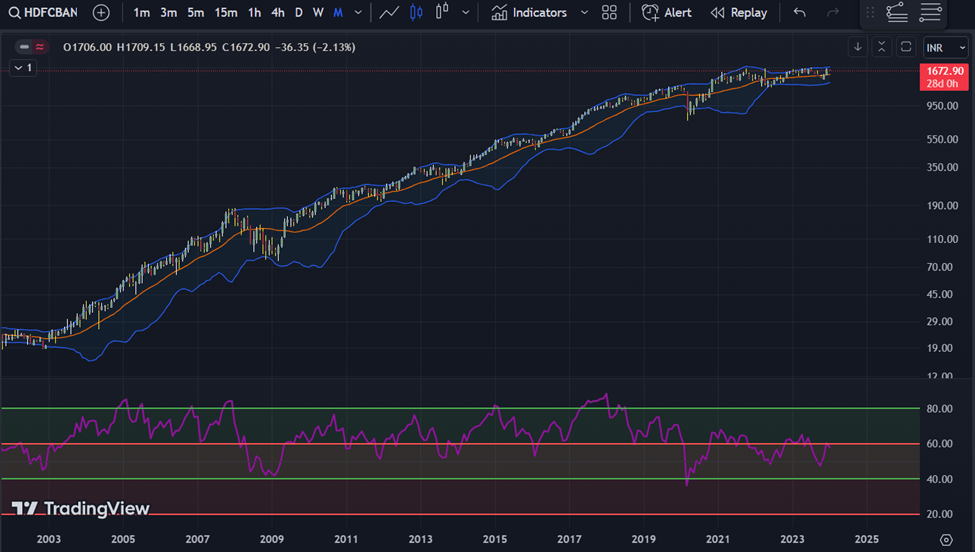
Short-Term Monthly Chart: Navigating Current Challenges
Zooming in on the last 2-3 years reveals a near all-time high stock price. However, the monthly chart suggests a temporary resistance and sideways movement, hinting at a potential breakthrough if it surpasses the recent high.
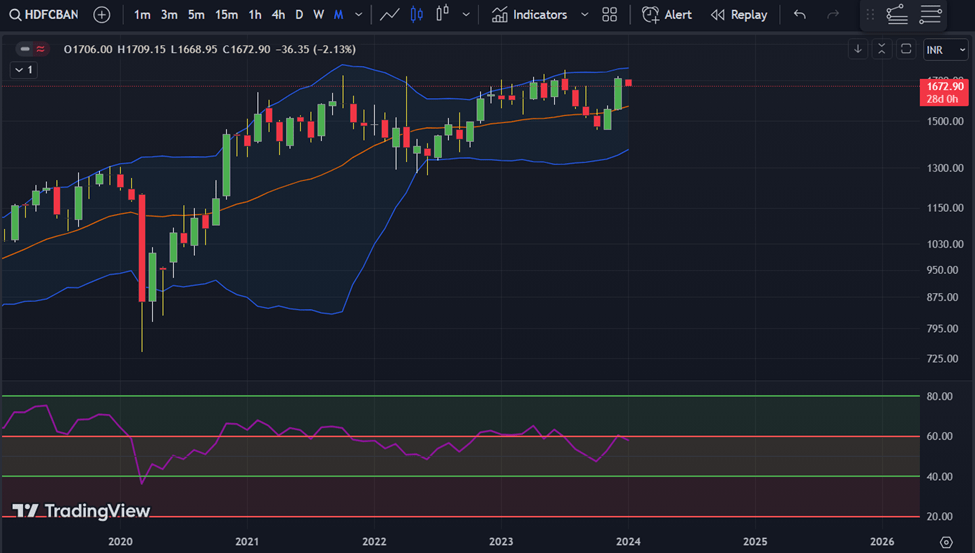
Key Observation:
Resistance Level (Monthly): 1757
Weekly Chart: Recent Rally and Halfway Mark
Analyzing the weekly chart unveils a recent rally, witnessing the stock surge from 1400 to 1650. The price encountered resistance at this level, indicating a possible pause or consolidation phase before the next move.
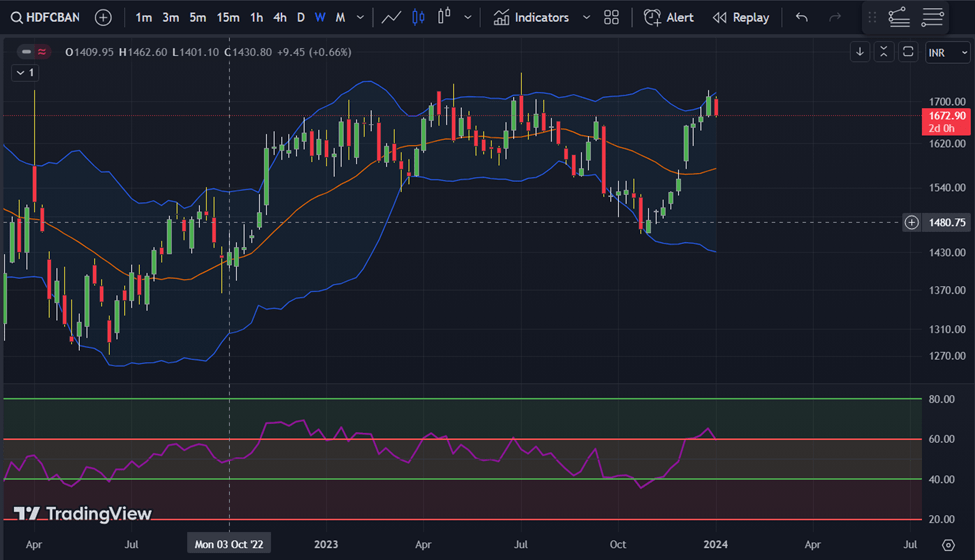
Key Observation:
Recent Resistance (Weekly): 1650
Daily Chart: Confirming the Rally
The daily chart mirrors the recent weeks’ rally, approaching a minor resistance point. A breakthrough of this level could pave the way for further upward movement, offering a potential buying opportunity.
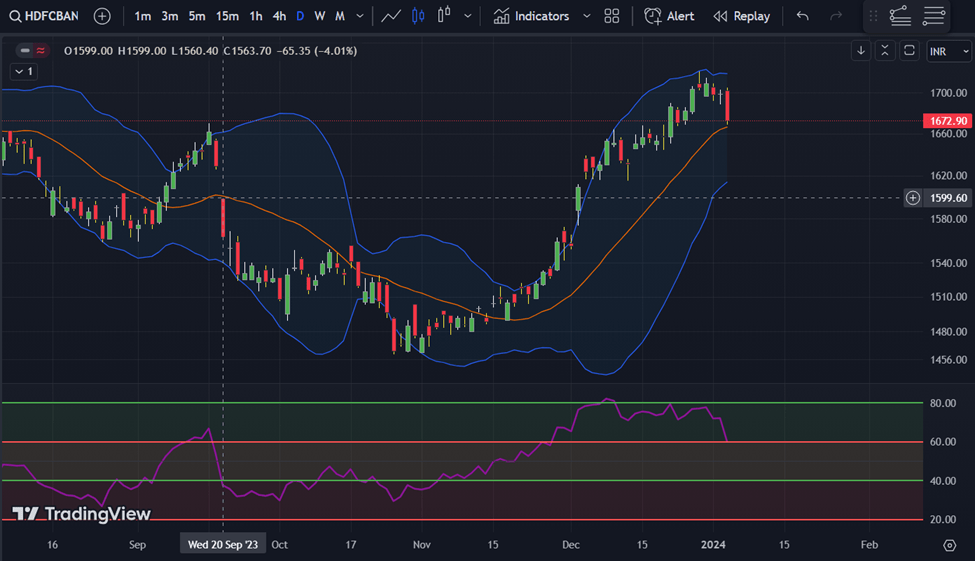
Key Observation:
Short-Term Resistance (Daily): 1752
Short-Term Outlook: Exercise Caution
While the technical indicators suggest the possibility of an upward trajectory, caution is advised for the short term. It is not an ideal moment for immediate investment based on the technical analysis alone.
Key Considerations:
Current Short-Term Caution: Due to recent resistance and sideways movement.
Long-Term Outlook: Potential for a Breakout
For investors with a long-term horizon and a focus on fundamentals, a breakout above the recent high could signal a favorable entry point.
Key Recommendation:
Long-Term Buy: Pending confirmation of the breakout and favorable fundamentals.
In summary, HDFC Bank’s technical analysis hints at a nuanced scenario. While short-term caution is advised, the long-term outlook remains optimistic, especially if supported by strong fundamentals and a breakout beyond key resistance levels. Always conduct thorough research and consider a holistic approach before making investment decisions.
Please find the FUNDAMENTAL ANALYSIS on ALOK INDUSTRIES.
2 thoughts on “Mastering the Art of Fundamental and Technical Analysis of HDFC Bank 2024”